
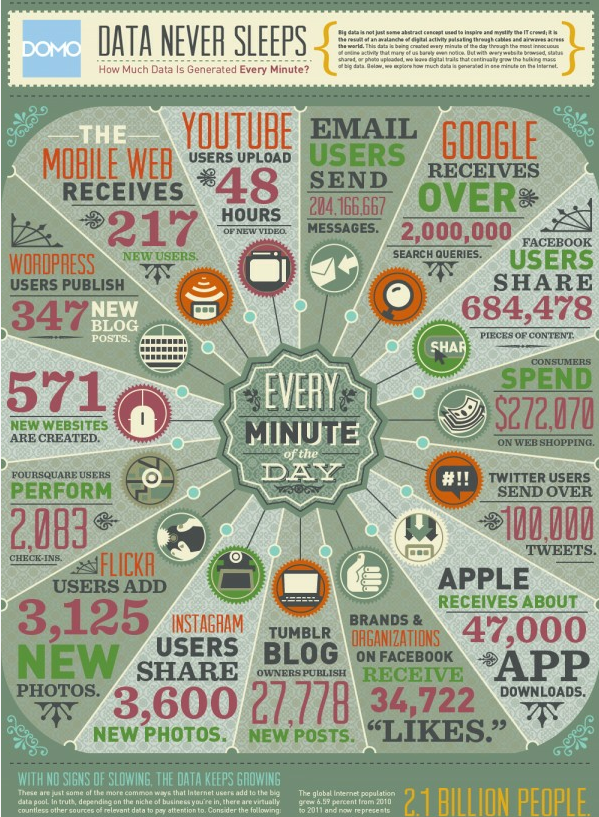
How Much Data is Generated Every Minute?
This infographic by Visual News gives a nice intro to Big Data. It’s not just limited to finance or scientific/medical research.
This infographic by Visual News gives a nice intro to Big Data. It’s not just limited to finance or scientific/medical research.
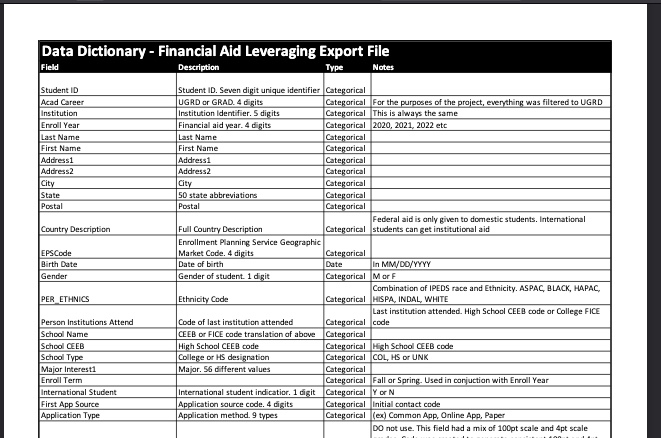
The census file and the bi-weekly interim files all have the same format. With this process, most of the time is spent ensuring that the data file is clean and properly configured. Below is a data dictionary of a sample file.
In my last post I argued that the AI debate runs simultaneously at five levels (task, person, organization, economy, civilization) and that no one has agreed on which level should have standing. The civilization level, where the hardest questions live and where costs tend to concentrate, keeps getting treated as decorative. Nobody is lying. Everyone…
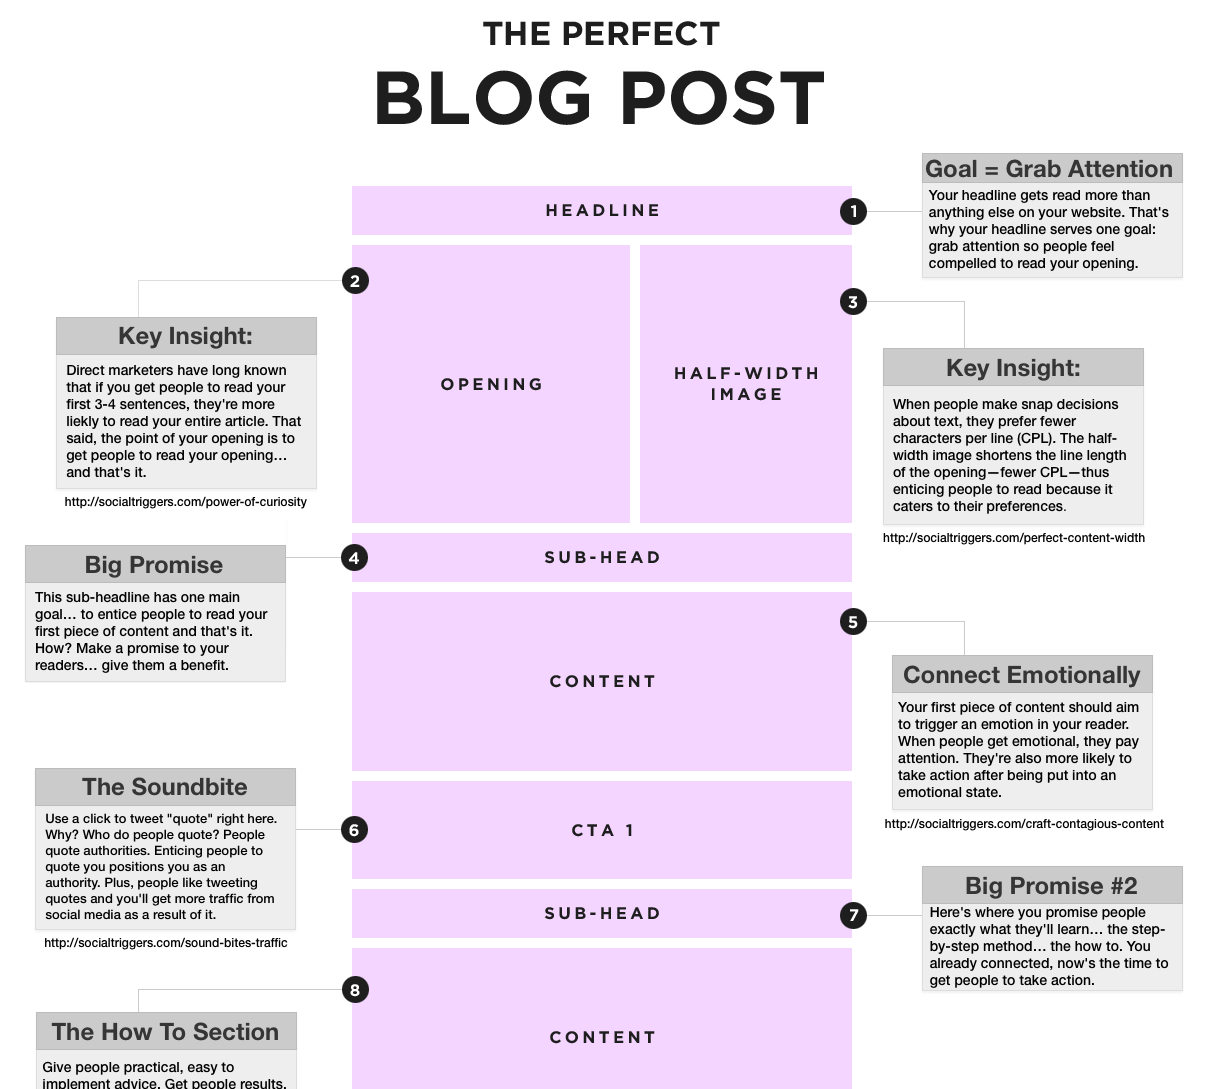
An excellent guide by Derek Halpern from Social Triggers Like this? Listen to this interview with Dan Ariely from Social Triggers.


I posted the following to Quora to see if I can help solve a problem for a group I work with. I figured if I get a solution, I’ll post it here and maybe it’ll help someone else. I belong to an 37,000 member alumni organization that needs a minimum number of 100 voters at…
