
Trends in MOOC adoption (Infographic)

Infographic authored by Enterasys Networks. To view the original post, see the original Trends in adoption of MOOC Infographic

Infographic authored by Enterasys Networks. To view the original post, see the original Trends in adoption of MOOC Infographic
I thought the next layer would be more Obsidian configuration. It wasn’t. More graph view, more backlinks, more manual connection-making. That is what I used to do in Roam. I would spend real time threading notes together, following paths between ideas, maintaining a map of how everything connected. I did not do any of that….
This article from 2009 acknowledges the difficulty and suggests dos and don’ts. “…as past research has repeatedly shown, even the smallest degrees of dispersion, such as working on different floors in the same building, can greatly affect the quality of collaboration…. We found that virtual teams offer tremendous opportunities despite their greater managerial challenges. In…
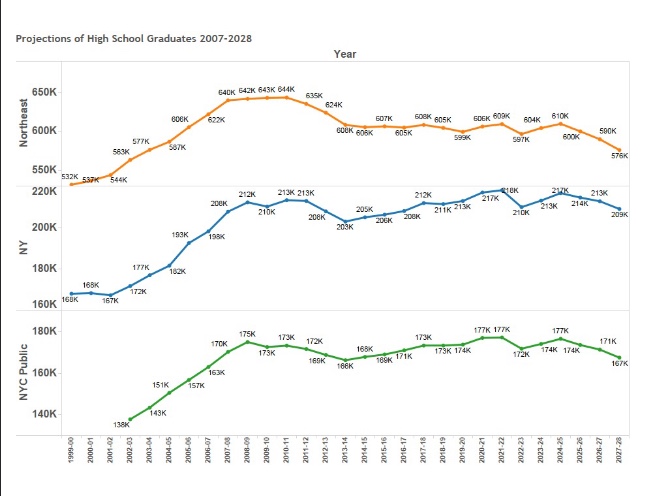
Data from the Department of Education. Visualization is done in Tableau. This is a PDF of the output. As mentioned in many outlets already, the Northeast is in for a rough few years.