-
-
-
Imagine if your computer had an automatic reason-checker, alongside the spell-checker
Select Quotes: 11:20 “Professor Chris Reed is working with the BBC on reason-checking tools, to supplement fact-checking, using AI techniques known as ‘argument technology’.” Select quotes below. 11:59 “And by argument we don’t mean row [squabble]. We mean a reasoned series of steps drawing to a conclusion” 12:36 “It brings together the facts, history, and…
-
-
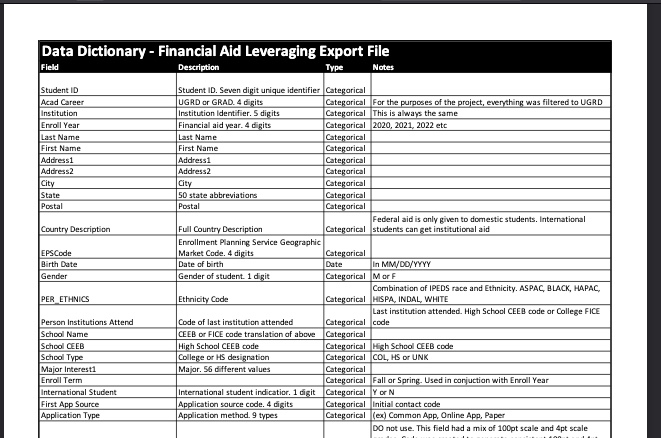
Financial Aid Optimization Process 2 of 2 – Sample extract file format
The census file and the bi-weekly interim files all have the same format. With this process, most of the time is spent ensuring that the data file is clean and properly configured. Below is a data dictionary of a sample file.
-
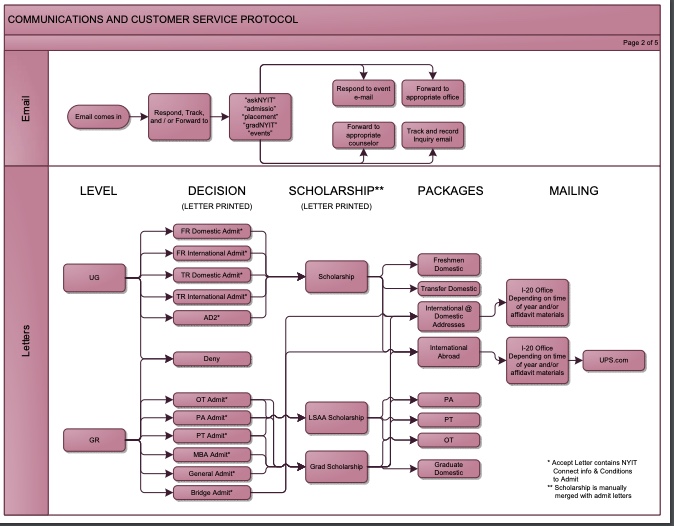
Process Flow Diagrams – Enrollment Operations Example
Why create process flow diagrams? Because it helps to have an official way of doing things. It helps with the onboarding of new employees. Having documented process flows forces you to sit down with all the stakeholders and reexamine the routine and its assumptions. What processes are dependent on others?What processes can be run concurrently?…
-
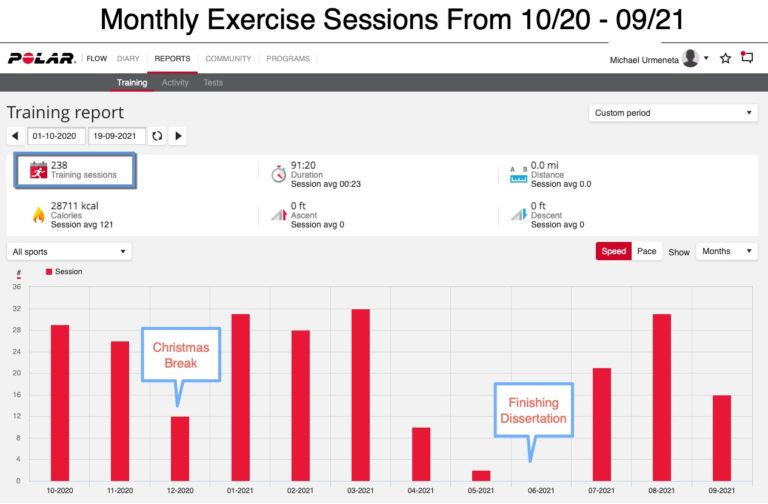
Year in Review: Exercise
During the pandemic, I committed to exercising regularly. Here’s a simple snapshot of a year’s worth of data. The dropoffs happened after Thanksgiving and right before my dissertation defense. Need to work on maintaining the habit during the holidays and periods of stress.
-
Takeaways from The Social Dilemma
A year ago, I tweeted about #TheSocialDilemma. I figured I should also create a post about it https://twitter.com/michaelurmeneta/status/1307853103430066176 “For the last 10 years, the biggest companies in Silicon Valley have been the business of selling their users” – Roger McNamee The classic saying is that “If you’re not paying for the product, then you are…
-
Financial Aid Optimization Process 1 of 2 – Overview
I have worked with Ruffalo Noel Levitz, Maguire Associates, and Hardwick Day (now EAB). They all follow a similar process. Start with the big picture Take 3-5 years of data and look at the numbers in the aggregate Calculate the highs and lows Do a Monte Carlo simulation to determine the most likely data ranges…
-