
How Much Data is Generated Every Minute?
This infographic by Visual News gives a nice intro to Big Data. It’s not just limited to finance or scientific/medical research.
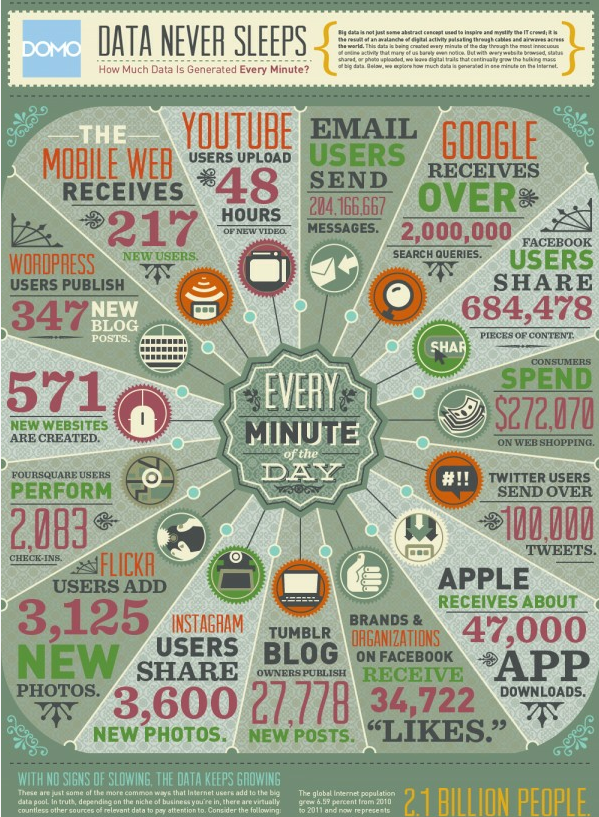
This infographic by Visual News gives a nice intro to Big Data. It’s not just limited to finance or scientific/medical research.

I posted the following to Quora to see if I can help solve a problem for a group I work with. I figured if I get a solution, I’ll post it here and maybe it’ll help someone else. I belong to an 37,000 member alumni organization that needs a minimum number of 100 voters at…

“Don’t Blame Me” was written by Geoffrey Canada in 2007. He recited it at the 70th National Association for College Admissions Counseling (NACAC) Conference in Indianapolis on September 18, 2014 The girl’s mother said, “Don’t blame me. Her father left when she was three. I know she don’t know her ABCs, her 1,2,3s, But I…
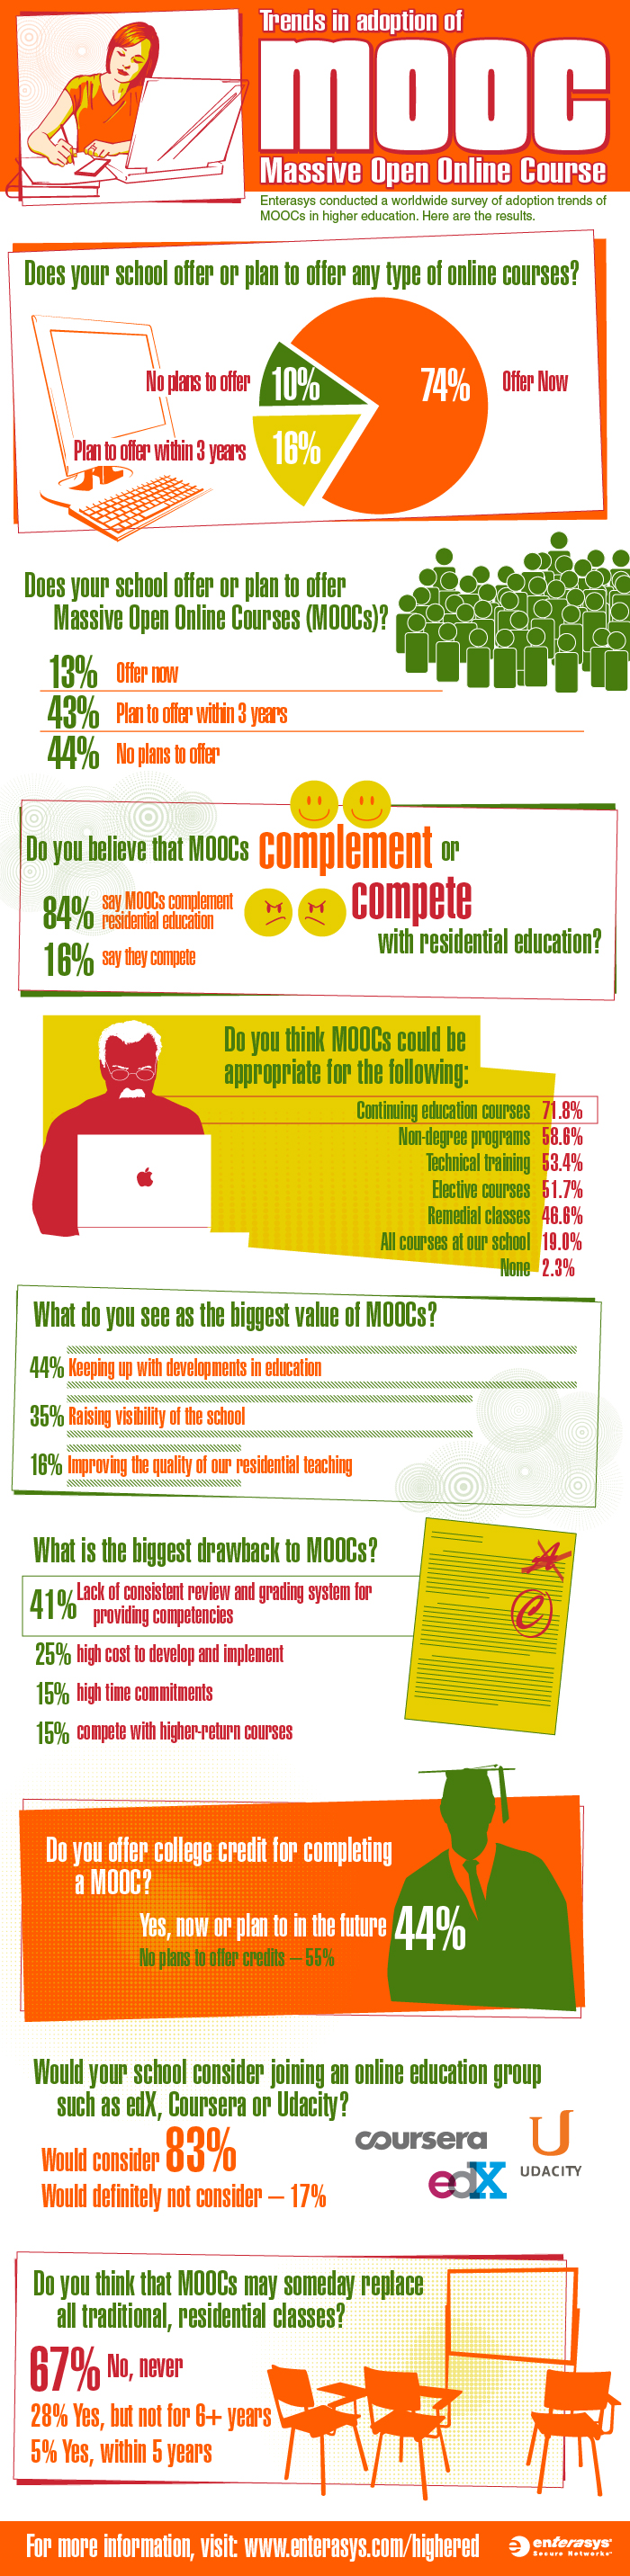
Infographic authored by Enterasys Networks. To view the original post, see the original Trends in adoption of MOOC Infographic
rel=”nofollow” /a>
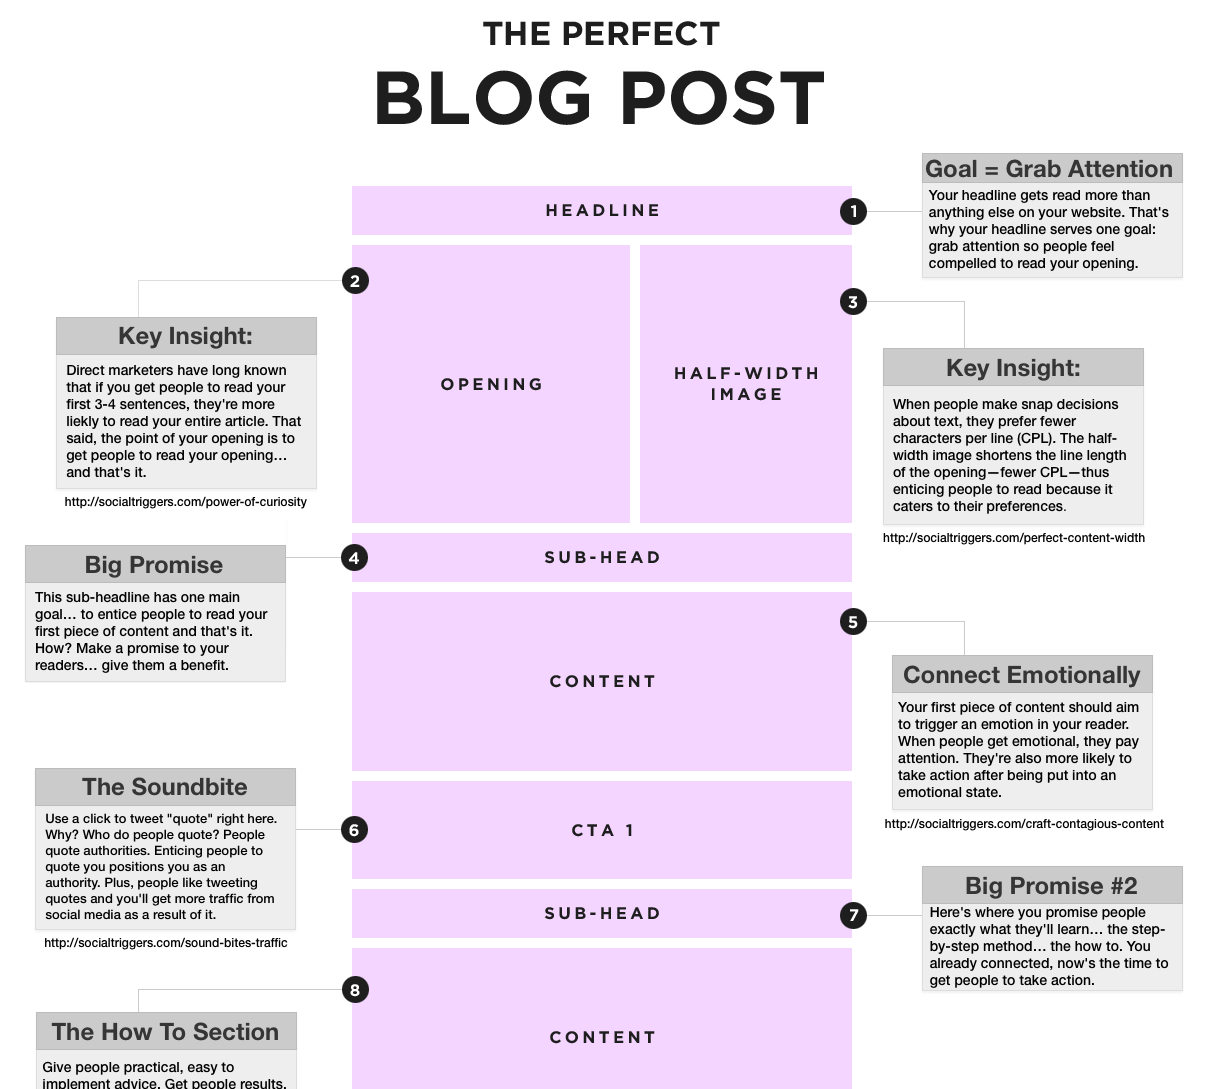
An excellent guide by Derek Halpern from Social Triggers Like this? Listen to this interview with Dan Ariely from Social Triggers.
In 2018, I had the honor of meeting Dr. Cathy O’Neil, author of Weapons of Math Destruction: How Big Data Increases Inequality and Threatens Democracy. It’ll change the way you look at data. Catch her blog here: https://mathbabe.org/
