
How Much to Save for Retirement – Are You on Track? (Infographic)

“How Much to Save for Retirement – Are You Ready?” – An infographic by Money Crashers Personal Finance

“How Much to Save for Retirement – Are You Ready?” – An infographic by Money Crashers Personal Finance
I thought the next layer would be more Obsidian configuration. It wasn’t. More graph view, more backlinks, more manual connection-making. That is what I used to do in Roam. I would spend real time threading notes together, following paths between ideas, maintaining a map of how everything connected. I did not do any of that….
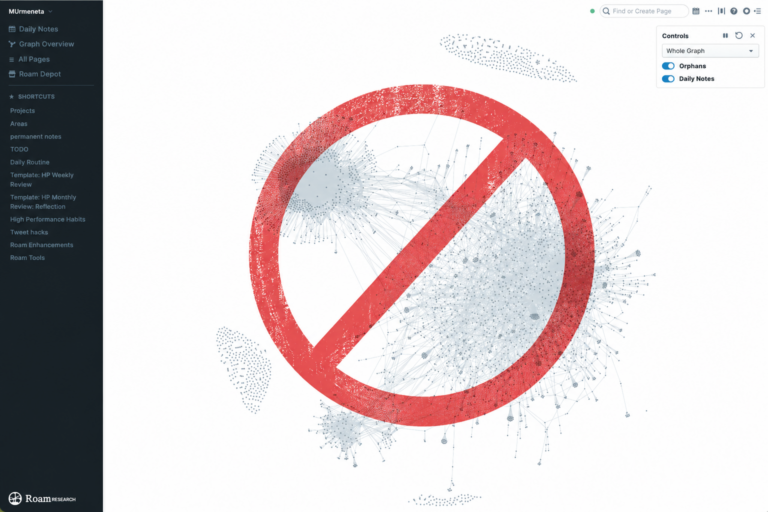
I did not add backlinks. That was supposed to be the next step. The May 9 post said so explicitly. I had Obsidian pointed at the folder, the graph view was open, and the Zettelkasten people would tell you this is where the system comes alive. You start linking notes to each other. The connections…

I’ve been through every productivity system you’ve heard of and a few you probably haven’t. I’ve built Kanbans and Zettelkastens and cycled through Evernote, Obsidian, Roam Research, Notion. During my doctoral program I ran a paper planner alongside digital tools, alongside whatever else I was trying that year. Most of it worked. Which is what…