Year in Review: Exercise
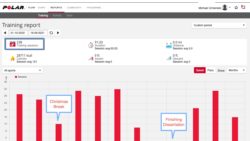
During the pandemic, I committed to exercising regularly. Here’s a simple snapshot of a year’s worth of data. The dropoffs happened after Thanksgiving and right before my dissertation defense. Need to work on maintaining the habit during the holidays and periods of stress.