
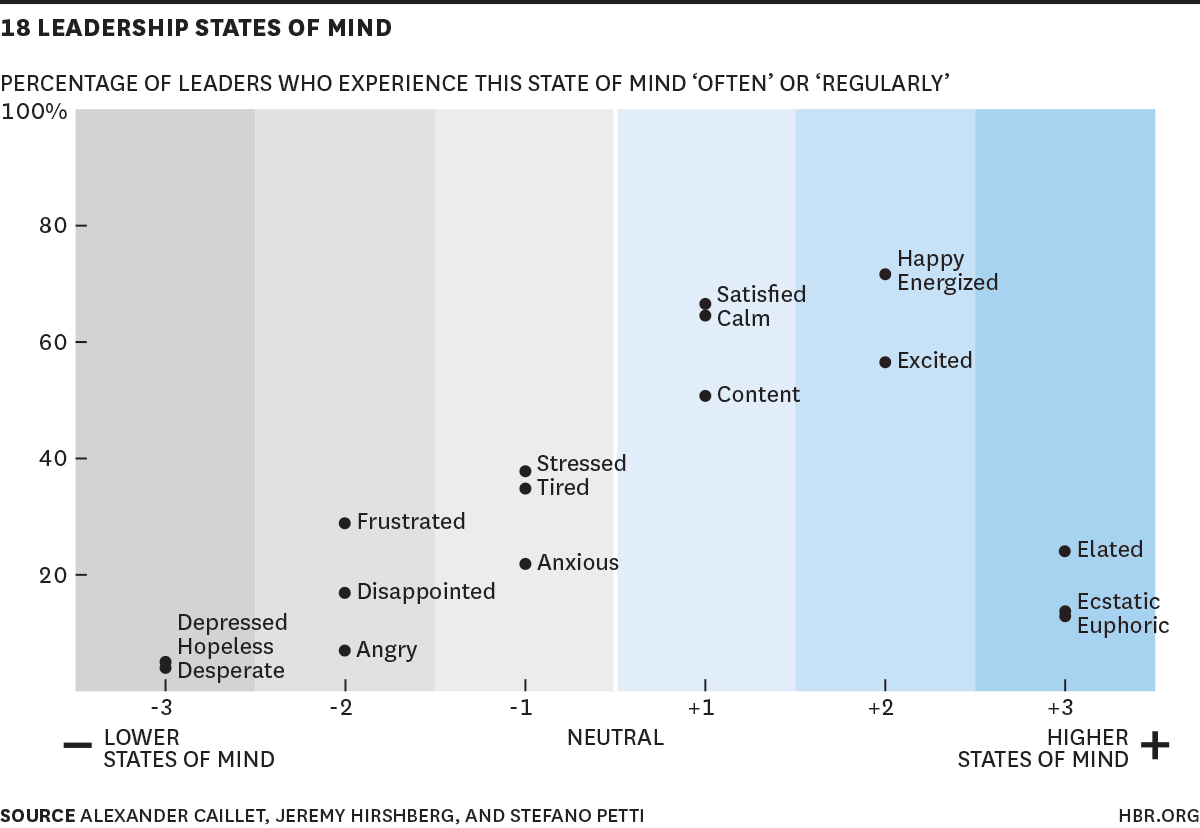
18 Leadership States of Mind
Survey results with the 18 states of mind that top leaders experience – and the percentage of time spent in each. Note that top leaders spend more of their time in “higher states” (60-80%).


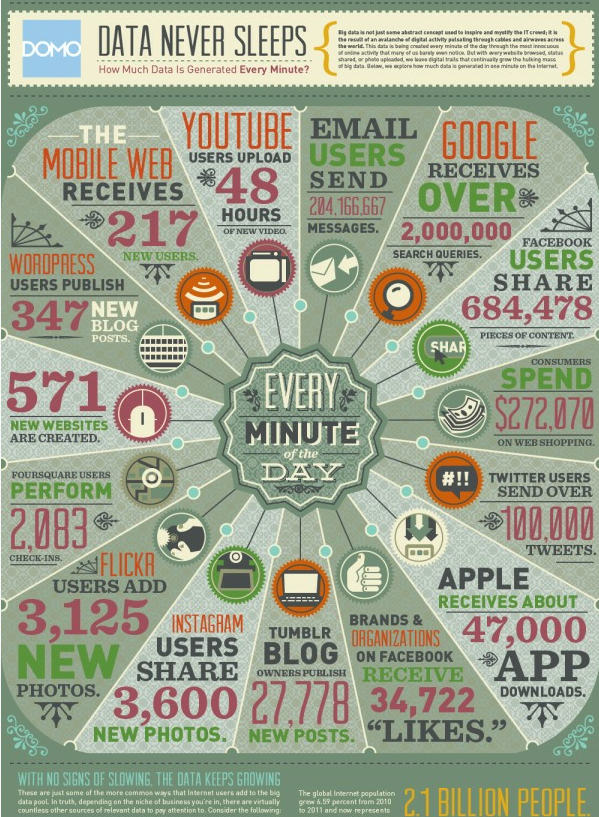
This infographic by Visual News gives a nice intro to Big Data. It’s not just limited to finance or scientific/medical research. Infographic by Visual News
I thought the next layer would be more Obsidian configuration. It wasn’t. More graph view, more backlinks, more manual connection-making. That is what I used to do in Roam. I would spend real time threading notes together, following paths between ideas, maintaining a map of how everything connected. I did not do any of that….
I have worked with Ruffalo Noel Levitz, Maguire Associates, and Hardwick Day (now EAB). They all follow a similar process. Start with the big picture Take 3-5 years of data and look at the numbers in the aggregate Calculate the highs and lows Do a Monte Carlo simulation to determine the most likely data ranges…

“How Much to Save for Retirement – Are You Ready?” – An infographic by Money Crashers Personal Finance

Infographic authored by Enterasys Networks. To view the original post, see the original Trends in adoption of MOOC Infographic