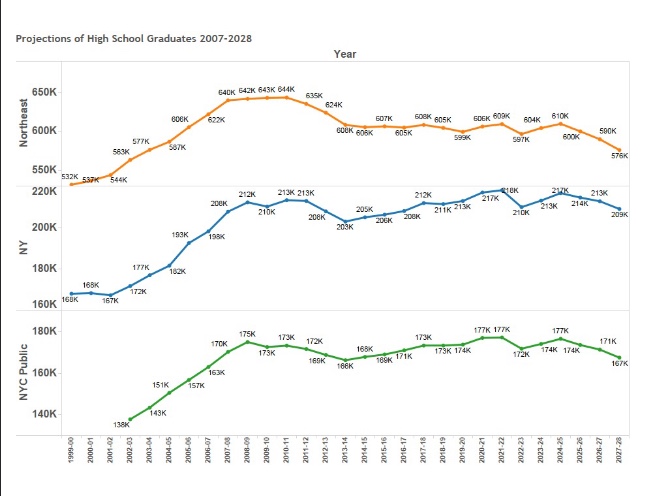
Projection of High School Graduates 1999-2028 – Tableau
Data from the Department of Education. Visualization is done in Tableau. This is a PDF of the output. As mentioned in many outlets already, the Northeast is in for a rough few years.
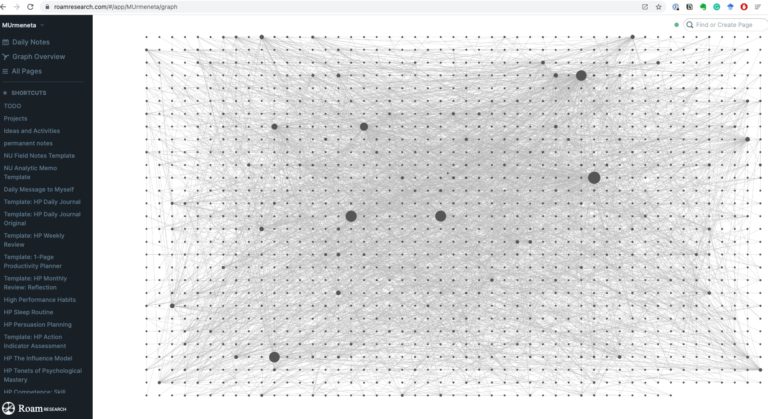
I started using #RoamResearch on August 2, 2020 Here is my #RoamGraph as of September 2021. It’s a networked note-taking tool that I’ve used to create a personalized knowledge web. Some of the things I’ve funneled into it are: (a) academic research, (b) book summaries, (c) meeting minutes, (d) webinar notes, (e) journal entries, (f) website clippings, (g) instructions,…
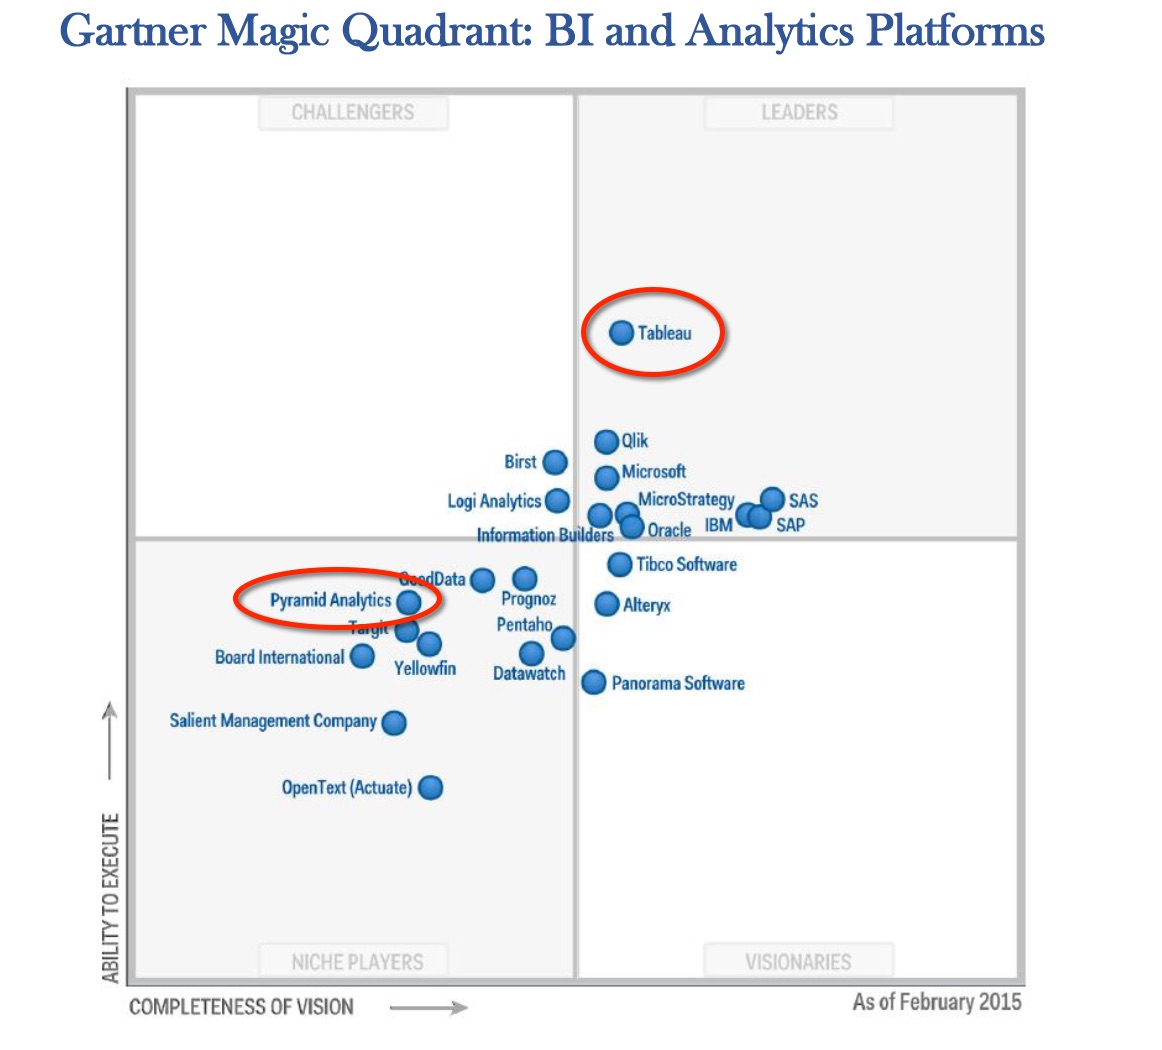
This article from 2009 acknowledges the difficulty and suggests dos and don’ts. “…as past research has repeatedly shown, even the smallest degrees of dispersion, such as working on different floors in the same building, can greatly affect the quality of collaboration…. We found that virtual teams offer tremendous opportunities despite their greater managerial challenges. In…
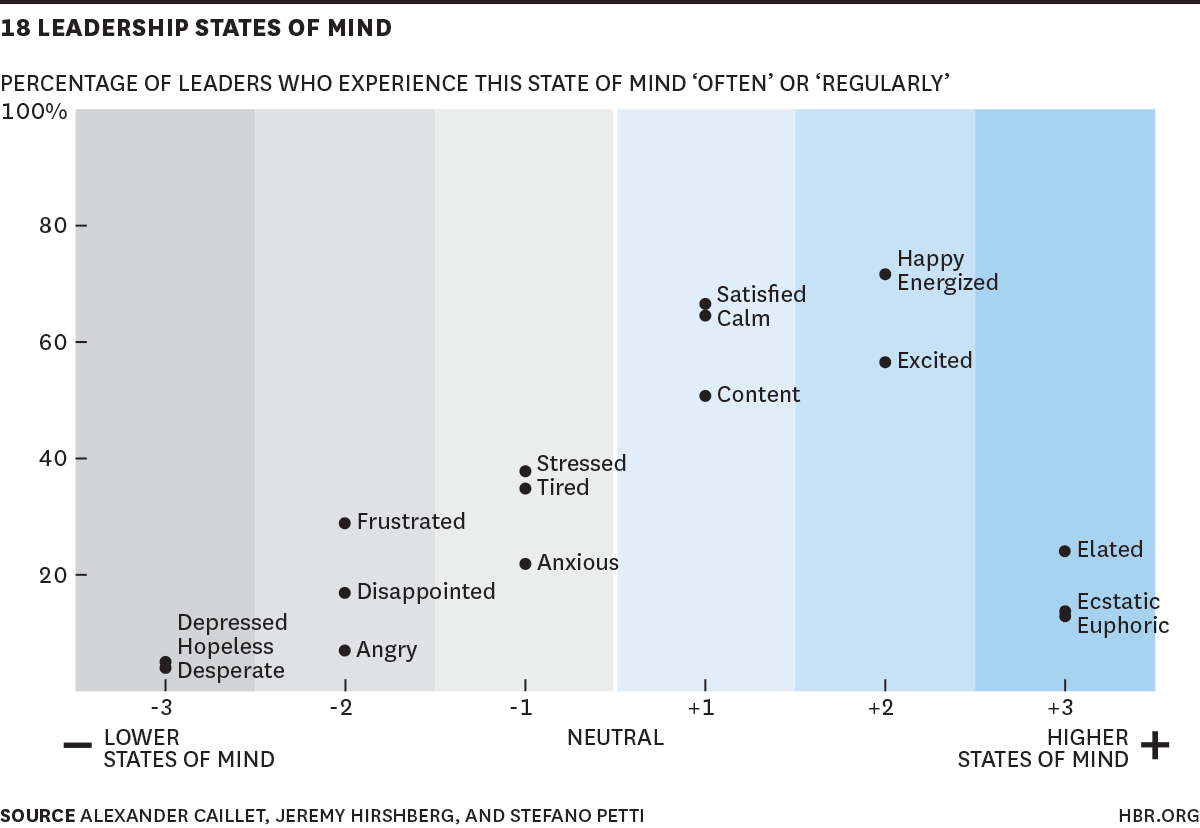
Survey results with the 18 states of mind that top leaders experience – and the percentage of time spent in each. Note that top leaders spend more of their time in “higher states” (60-80%).
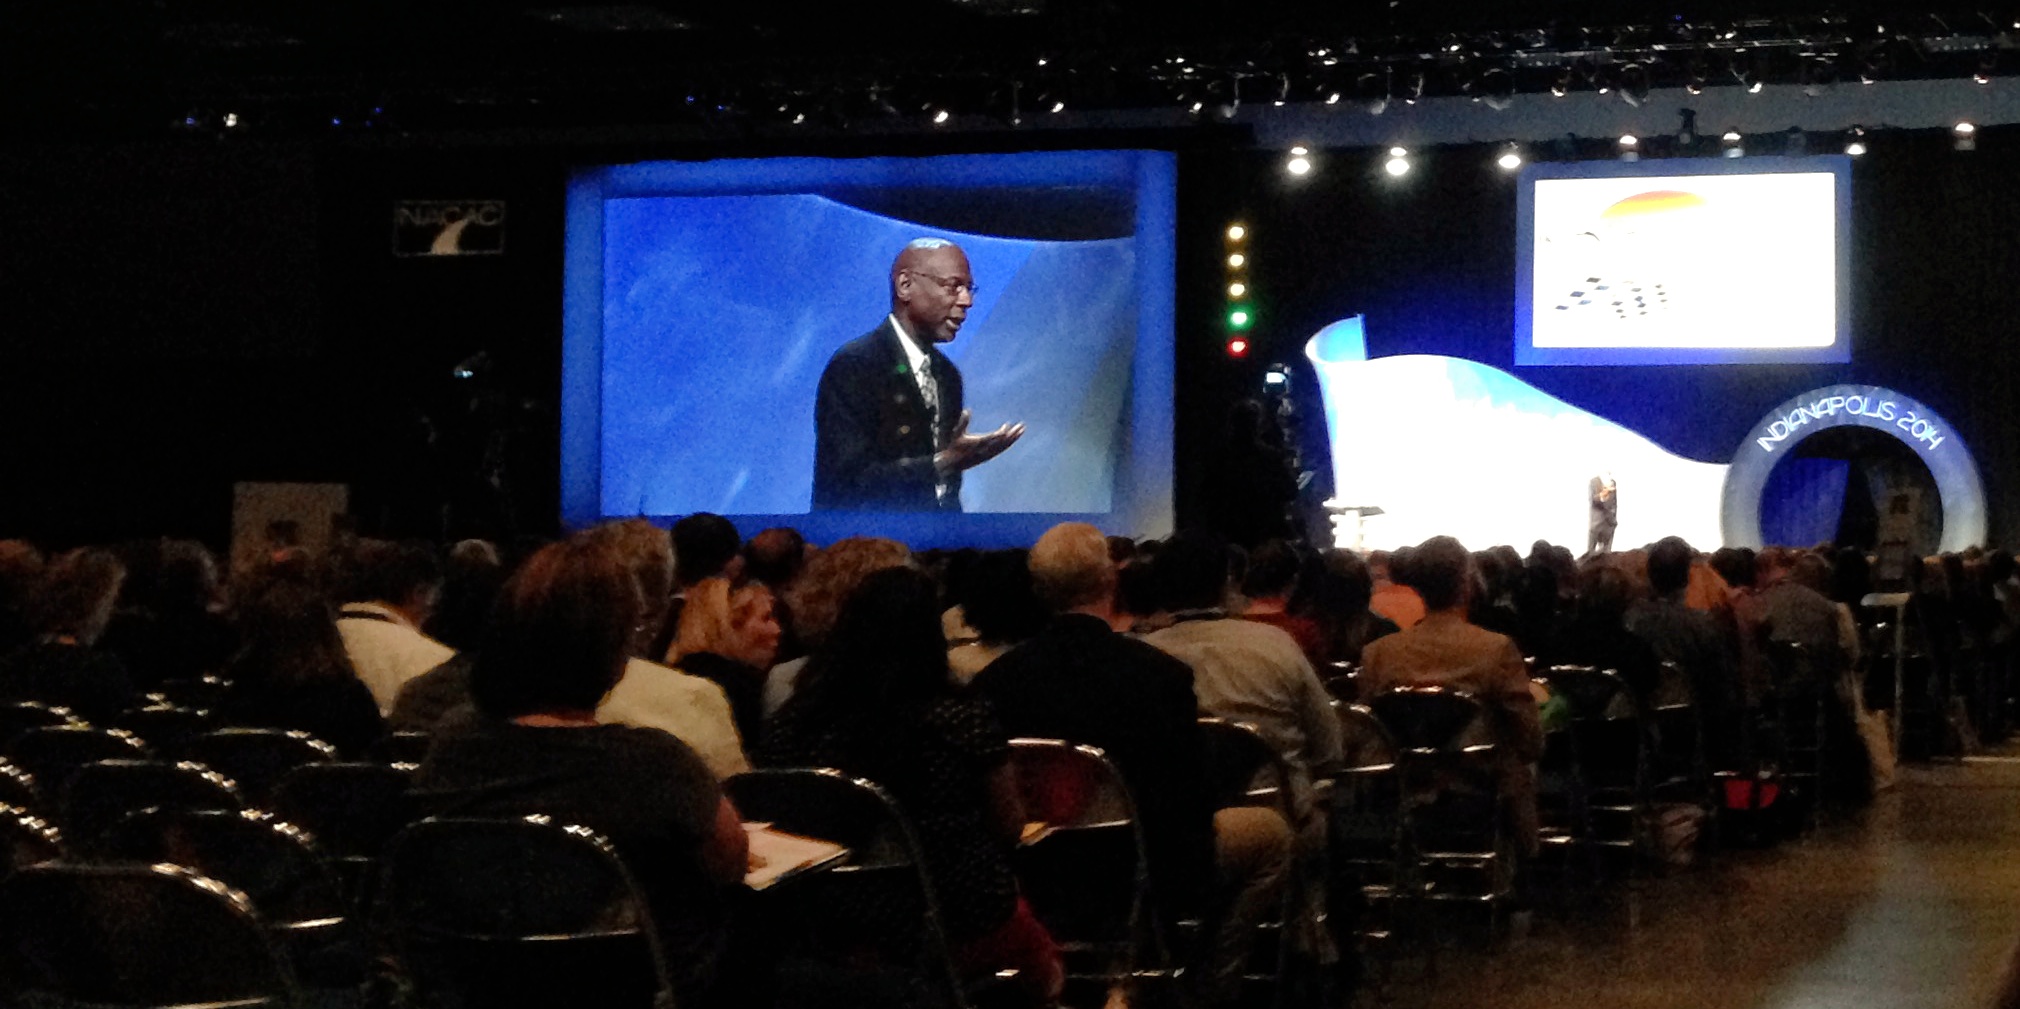
“Don’t Blame Me” was written by Geoffrey Canada in 2007. He recited it at the 70th National Association for College Admissions Counseling (NACAC) Conference in Indianapolis on September 18, 2014 The girl’s mother said, “Don’t blame me. Her father left when she was three. I know she don’t know her ABCs, her 1,2,3s, But I…
Source: DegreeLibrary.org
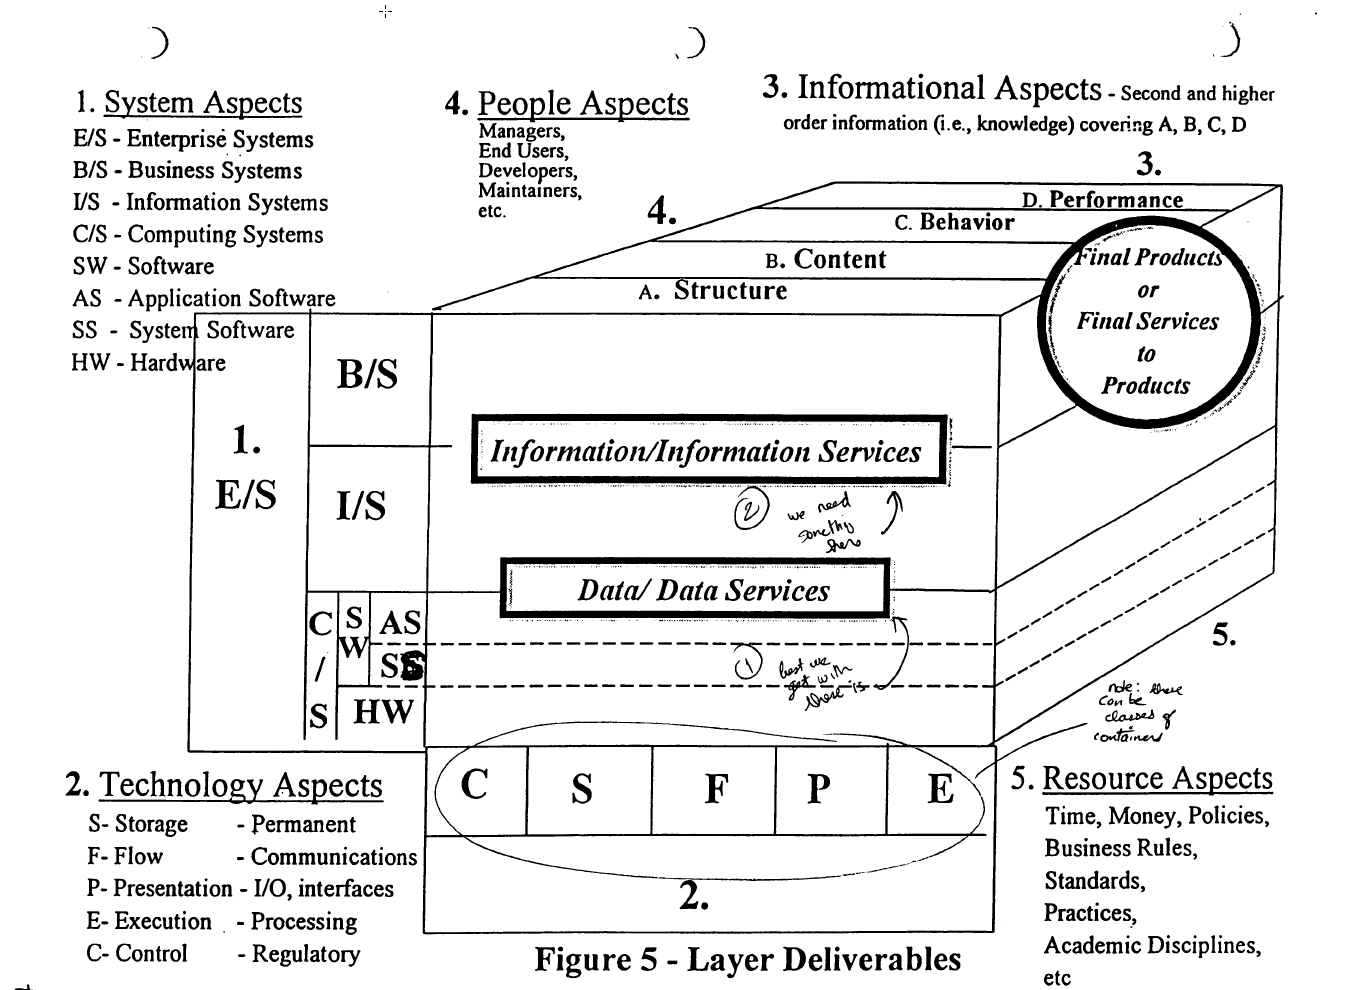
This was From a class I took well over a decade ago. I’m posting it here as a reminder to myself. Though the layers are interdependent, everything flows from the business one. Learn to navigate all three. Understand how the enterprise works and figure out where you can add value.
rel=”nofollow” /a>